
Blog
10 Best Computer Graphic Design Images for Business
Business graphics do more than decorate a page. They help customers understand what a company offers, recognize its identity, and decide what to explore next. The right Computer Graphic Design Images can make a product page feel clearer, a presentation more persuasive, or a social post easier to remember. But a polished image is not automatically an effective one. It must suit the audience, support the message, and remain readable on the screen where people will see it.
This guide explores ten useful image styles for business, including logo concepts, product mockups, data visualizations, icons, and campaign graphics. Each can solve a different communication problem. A crisp dashboard illustration may help explain a service, while a warm, detailed product scene can show scale and texture. Small choices matter: contrast, spacing, color, and image resolution can affect whether a graphic feels trustworthy or confusing. Keep it simple.
The strongest option depends on the brand, the channel, and the purpose of the image. A design that works in a large presentation may lose detail on a phone. Before choosing, check licensing terms, confirm that important text remains legible, and consider whether the image is accessible to people with visual impairments. These recommendations are practical, not universal rules; some businesses may need a quieter style, and others may need more experimentation. A little doubt is useful. The aim is not simply to look impressive, but to communicate clearly and honestly.
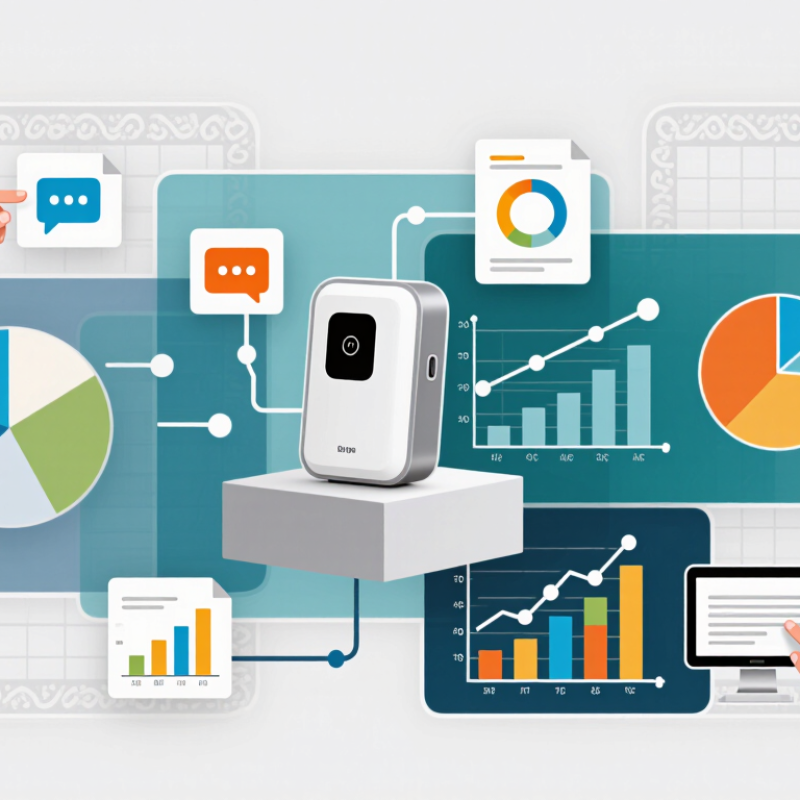
What Computer Graphic Design Images Mean for Business
10 Best Computer Graphic Design Images for Business
Computer graphic design images are more than decoration; they help businesses explain value at a glance. A clear product illustration can show how a service works, while a chart can make a dense report easier to scan. Consistent colors, type, and image style also make a company’s materials feel connected across a website, presentation, and storefront. That matters. A 2018 Business Value of Design report examined 300 publicly listed companies. Over five years, top-quartile design performers achieved 32 percentage points more revenue growth and 56 points higher total shareholder returns than industry benchmarks. This is an association, not proof that images alone drive results.
Tips: Match each image to one task: explain, compare, or prompt action. Use real product details, readable labels, and enough empty space. Check how the image looks on a small phone screen.
A polished image can still feel strangely empty if it says nothing specific. A generic handshake may look professional, yet it rarely explains why a service is useful. Choose visuals that reflect real customer questions, such as a labeled process diagram or a close-up showing material texture. Review contrast and text size before publishing. Small details are easy to miss. And not every image needs to sell; some should simply make a complex idea easier to understand.
10 Best Computer Graphic Design Images for Business - What Computer Graphic Design Images Mean for Business
A practical selection of graphic image types for common business needs. The ranking is editorial; the most suitable choice depends on the audience, message, and channel.
| # | Graphic Image Type | Typical Business Use | Useful Design Elements | Common Formats | Example Alt Text | Business Meaning |
|---|---|---|---|---|---|---|
| 1 | Product hero illustration | Product pages, landing pages, and digital campaigns | Clear focal point, product context, restrained background, room for a headline | SVG for vector artwork; PNG or WebP for raster artwork | “Illustration of a reusable water bottle beside a glass of water.” | Shows what is being offered and helps place it in a recognizable use context. |
| 2 | Process infographic | Explaining workflows, onboarding steps, or service processes | Numbered steps, consistent icons, concise labels, clear reading order | SVG or accessible HTML; PNG or WebP when an image is required | “Four-step diagram showing request, review, approval, and delivery.” | Makes a sequence easier to scan and can clarify what customers should expect. |
| 3 | Data visualization | Reports, presentations, dashboards, and research summaries | Accurate scales, labeled axes, readable legends, source notes, accessible colors | Editable chart or HTML; SVG, PNG, or WebP for export | “Bar chart comparing quarterly support requests across four categories.” | Turns numerical information into a visual comparison; the underlying data should remain available. |
| 4 | Service feature icons | Feature lists, navigation, and service overviews | Consistent stroke weight, simple shapes, clear labels, adequate contrast | SVG for scalable interface graphics; PNG for fixed-size use | “Shield icon next to the label ‘Data protection.’” | Provides quick visual cues, while accompanying text supplies the full meaning. |
| 5 | Product interface mockup | Product demonstrations, proposals, and feature explanations | Legible interface details, realistic content, clear annotations, uncluttered framing | PNG or WebP for screen mockups; SVG for simple diagrams | “Mobile app screen displaying a monthly expense summary and category list.” | Helps audiences understand how a digital product or interface is organized. |
| 6 | Editorial concept illustration | Articles, newsletters, and thought-leadership content | One central idea, relevant symbolism, consistent visual tone, space for cropping | SVG for flat vector art; WebP or PNG for raster illustrations | “Illustration of a team connecting pieces of a project timeline.” | Adds a visual entry point to an idea without replacing the article’s actual information. |
| 7 | Comparison graphic | Service options, product specifications, and decision guides | Parallel columns, matched criteria, neutral labels, clear distinctions | HTML table for accessible data; SVG or PNG for a designed summary | “Comparison table showing storage limits and support hours for three service levels.” | Makes differences easier to assess when the criteria are stated consistently. |
| 8 | Campaign social graphic | Social posts, event announcements, and promotional updates | Short message, strong hierarchy, platform-appropriate crop, readable contrast | PNG or WebP; keep editable source files for revisions | “Event announcement graphic with date, topic, and registration details.” | Communicates a timely message in a compact format; essential details should also appear as text. |
| 9 | Customer journey map | Planning customer experiences, service design, and internal workshops | Stages, customer actions, touchpoints, pain points, and clearly identified assumptions | Editable diagram; PDF or SVG for sharing and print | “Journey map showing discovery, purchase, setup, and support touchpoints.” | Helps teams discuss interactions across stages; findings should be based on research where possible. |
| 10 | Presentation cover and section graphic | Business presentations, proposals, and training materials | Consistent layout, clear title area, simple visual motif, presentation-safe contrast | SVG or PNG; retain editable slides for updates | “Presentation cover graphic featuring an abstract network of connected points.” | Creates a visual framework for a presentation and supports consistent section navigation. |
Accessibility note: provide useful alternative text for informative images, use empty alternative text for decorative images, and avoid placing essential information only inside an image.